标题: 通信原理实验一源代码及图 [打印本页]
作者: liuqq 时间: 2015-5-19 20:37
标题: 通信原理实验一源代码及图
t0=0;
ts=0.000001;
t1=0.004;
fs=1/ts;
df=0.25;
t=t0:ts:t1;
%fs=1000000;
N=4000;
w=(0:N)*fs/(N+1)-fs/2;
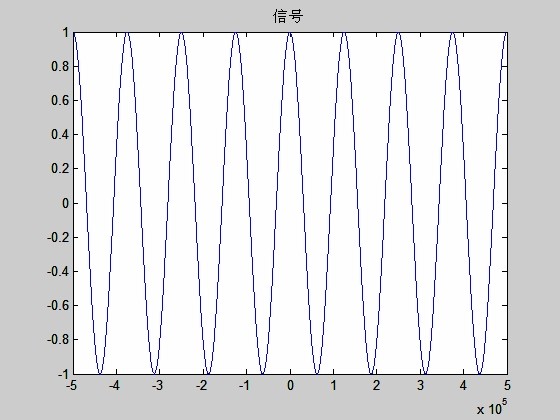
m=cos(2*pi*2000*t);
figure
plot(w,m)
title('信号');
N=4000;
w=(0:N)*fs/(N+1)-fs/2;
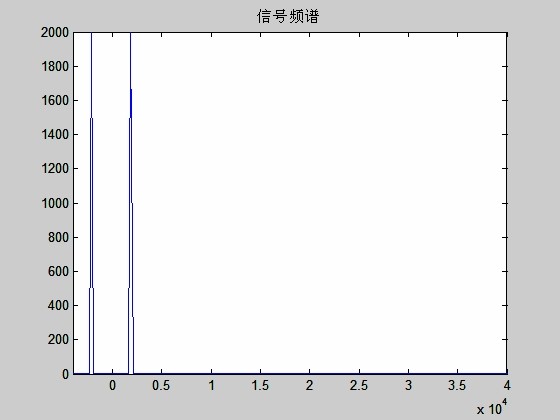
Y1=fftshift(abs(fft(m)));
figure(2)
plot(w,Y1)
title('信号频谱');
axis([-4000,40000,0,2000])
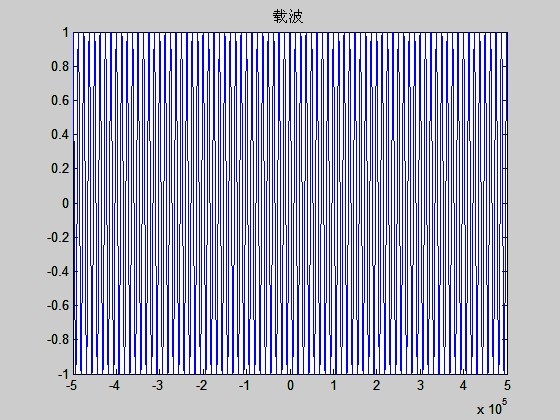
c=cos(2*pi*20000*t);
figure(3)
plot(w,c)
title('载波');
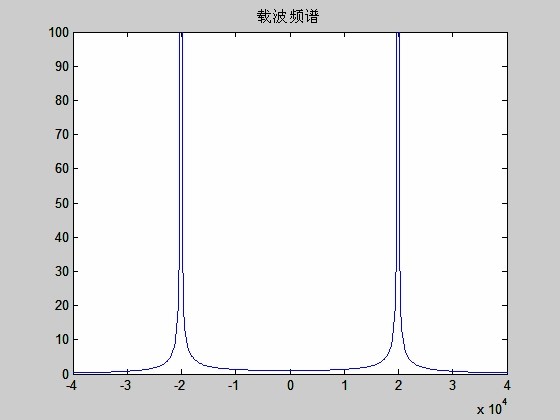
Y2=fftshift(abs(fft(c)));
figure(4)
plot(w,Y2)
title('载波频谱');
axis([-40000,40000,0,100])
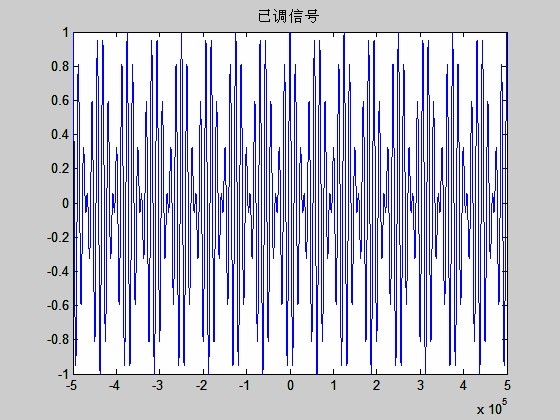
s=m.*c;
figure(5)
plot(w,s)
title('已调信号');
Y3=fftshift(abs(fft(s)));
figure(6)
plot(w,Y3)
title('已调信号频谱');
axis([-4000,4000,0,2000])
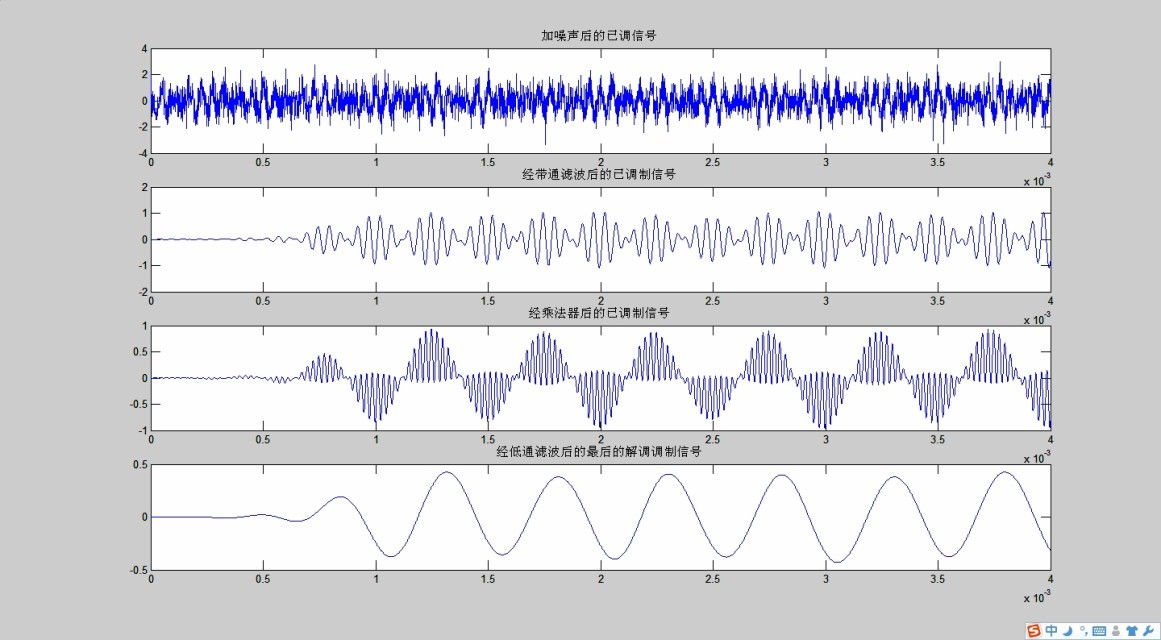
y3= awgn(s,3);
subplot(4,1,1);
plot(t,y3);
title('加噪声后的已调信号');
fsamp = 1e6; %采样频率为1MHz
fcuts = [16000 17500 22500 24000];
mags = [0 1 0];
devs = [0.05 0.01 0.05];
[n,Wn,beta,ftype] = kaiserord(fcuts,mags,devs,fsamp);
hh = fir1(n,Wn,ftype,kaiser(n+1,beta),'noscale');
s1 = fftfilt(hh,y3);
subplot(4,1,2);
plot(t,s1);
title('经带通滤波后的已调制信号');
s2=c.*s1;
subplot(4,1,3);
plot(t,s2);
title('经乘法器后的已调制信号');
fsamp = 1e6; %采样频率为1MHz
fcuts = [3000 20000]; %通带截止频率为3000Hz,阻带截止频率为20000Hz
mags = [1 0];
devs = [0.01 0.05]; % 通带波动1%,阻带波动5%
[n,Wn,beta,ftype] = kaiserord(fcuts,mags,devs,fsamp);
hh2 = fir1(n,Wn,ftype,kaiser(n+1,beta),'noscale');
m0 = fftfilt(hh2,s2);
subplot(4,1,4);
plot(t,m0);
title('经低通滤波后的最后的解调调制信号');
| 欢迎光临 (http://www.51hei.com/bbs/) |
Powered by Discuz! X3.1 |